Showing posts with label charts. Show all posts

Detroit Lions 2011 Regular Season: Halfway There

>> 11.03.2011

Everyone is furiously trying to prove that this 6-2 start capped by a blowout of the Broncos is not the same as 2007’s 6-2 start capped by a blowout of the Broncos. I have something different in mind.

In the Old Mother Hubbard series, I attempt to contextualize individual Lions performances. We watch these guys all season long year after year after year, and we lose perspective on their strengths and weaknesses. I use Pro Football Focus data and radar charts to give you an at-a-glance impression of how Lions are performing against the high, low, and average NFL performances at the same position.

So, if we’re taking the temperature of the Lions at the bye/halfway point . . . why not do the same thing?

image

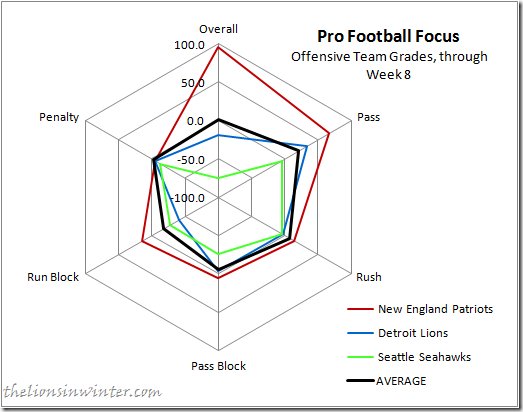
Here are the offensive team grades through Week 8. The dark red line is the New England Patriots, #1-graded offense in the NFL. The bright green line is the Seattle Seahawks, #32-graded offense in the NFL. The thick black line is, as always, the NFL average, and the Honolulu Blue line is the Lions.

This is going to surprise some folks, because we perceive the Lions offense to be one of the best in the NFL—and indeed it is the 4th-best, scoring 29.9 points per game. Keep in mind PFF’s “consistency bias,” as I call it: PFF’s system prefers consistently above-average play to streaky home-run hitters. It’s true for individual players like Ndamukong Suh and Jahvid Best, and it’s true for the Lions as a whole.

No surprise, the Lions’ pass offense was graded 8th-best, at +33.2. Also unsurprisingly, the Lions’ rushing game was well below average; the third-worst in fact. But look: the difference between the best running grades and the worst running grades is miniscule.  Having a very poor running game doesn’t grade out much worse than having an average running game. This is a recurring theme this season.

As far as the offensive line goes, it's no surprise to anyone who’s listened to me or PFF over the years: the Lions do an above-average job of pass blocking. They graded –3.7 (average –6.18) over the course of the season. Also no surprise: they can’t run block for crap. The Lions have the fourth-worst run-blocking line in the NFL to this point, at -40.8 (average –18.15).

On offense, the Lions have taken more penalties than most; they’re ranked 24th with a –5.5 penalty grade. However, since the NFL average is –3.11, that’s not crippling. On the whole, the grades show the Lions have a very good passing offense, a decent pass-blocking offensive line, a terrible running game and a terrible run-blocking offensive line. Add it all up and it’s surprisingly mediocre for a team scoring 30 points per game. Once again, we see: the running game doesn’t matter.

image

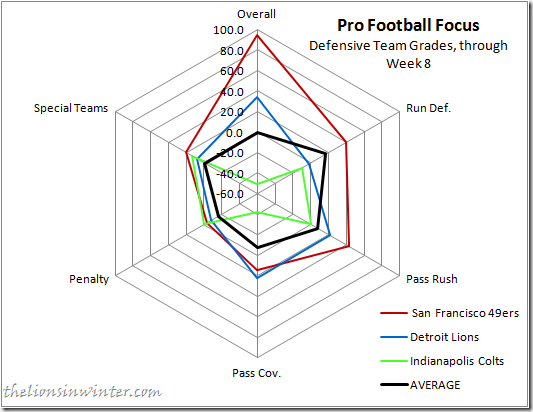
The 49ers have a ridiculous defense. I mean, geez. Just look at that. Also: Indy NOOOOOO!

But check out the Lions: 8th-best graded defense overall, graded +33.7. This jibes with their 6th-lowest scoring defense (18.4 PpG). The run defense is ranked 24th, just –2.2 overall—and the average is +14.8, meaning that’s truly not good. The pass rush, again, is what you’d think: 5th-best in the NFL, graded +21.7 (avg. +8.06).

The jawdropper, though: The Detroit Lions have the best pass coverage grade in the NFL. Not pass defense, not pass rush, not statistical derivation: the play of their corners and safeties grades out better than any other team in the NFL. At +22.1, they’re well ahead of the 49ers’ second-place unit (+14.4), and have lapped the rest of the field (avg. –7.74).

The Lions defense is, as it was last season, heavily penalized. Their -7.9 grade is ranked 27th, well below the –3.4 league average—but not as horrific as it’s been. Special teams-wise, the Lions grade out at +7.4—but that’s not all that, because the average is +12.65.

On the whole, we’re left with a promising, but mixed bag. The Lions offense is struggling to move the ball consistently, but is generating points through the air with home run plays. The run blocking is awful, as is the running game as a whole. The defense is a top ten unit, despite poor run-stopping and penalty grades, because they rush the passer better than most—and cover the pass better than anyone.

At the moment, the Lions are in fantastic shape for the playoffs. My favorite predictive football model, the Simple Rating System, LOVES what the Lions have done this year. It’s a combination of strength of schedule and points differential, and at the halfway point the Lions are the second-highest-rated team in the NFL. Given the teams they’ve played and the results of those games, SRS expects the Lions to be the second-hardest out in football (after the Packers) going forward.

Of course, the Lions play the Packers twice throughout the rest of the season, so SRS would project a final finish of 12-4. Could that really happen? Bizarrely, yes. The road games against Chicago and New Orleans are possible (if not likely) losses—but the Lions should be able to split with the Pack, considering they did so last season without Matthew Stafford. The games at Oakland and against San Diego are worlds less scary than they were a few weeks ago, too.

Let’s be clear: I’m not projecting, or claiming, or promising a 12-4 season. I AM promising, projecting, and claiming that the Lions are going to make the playoffs, as I have since May, and have never wavered from. The Lions are only halfway there, but right now that Lions Kool-Aid tastes sweeter than ever.

Read more...

The Hidden Detroit Lions Offense: 1st and 2nd Down

>> 10.26.2011

The Lions lost to the Falcons on Sunday, due to an astonishingly poor performance by the offense, and particularly Matthew Stafford. Many noticed the Lions seemed to be “in a lot of third-and-longs,” and blamed the lack of a power running game that could keep the Lions offense on schedule.

It’s been my contention the Lions use their backs in nontraditional—but effective—ways. If they can run for three or so yards on first down, that gives Stafford and the 7+ yard-per-attempt passing attack two attempts to get seven yards. If they can mix in the screens and draws on which Best and Morris are varyingly effective, they can move the ball very well and score points in bunches.

This has been empirically obvious: through five weeks the Lions had the #2 offense in the NFL, racking up an impressive 31.8 points per game. Subsequently, I have been directing all parties inquiring RE: fat guards and white running backs to talk to that statistical hand.

However, something is not adding up. Maurice Morris and Keiland Williams combined for over five YpC against the Falcons, yet indeed the Lions were constantly facing second- and third-and-long.

Chart?

Chart.

1ST DOWN RUN MM KW NB PASS CJ NB BP TS WH
22/8/6.59 12/2/3.8 7/0/2.0 5/2/6.4 0/0/0.0 10/6/9.9 5/3/16.2 1/0/0.0 1/1/9.0 1/1/6.0 1/1/8.0
2ND DOWN RUN MM KW NB PASS CJ NB BP TS WH
20/7/5.3 7/2/6.6 3/1/12.3 2/0/-1.0 2/1/5.0 13/5/4.62 4/1/6.25 1/0/1.0 3/2/5.0 2/2/13.0 0/0/0.0
TOTAL RUN MM KW NB PASS CJ NB BP TS WH
42/15/5.98 19/4/4.8 10/1/5.1 7/2/4.43 2/1/5.0 23/11/6.91 9/4/11.8 2/0/1.0 4/3/6.0 3/3/10.7 1/1/8.0

The Hidden Game of Football is a seminal book which tops every serious football analyst’s reading list (but which I still haven’t read). In it, so I am told, the authors outline a new way of defining a successful football play. On first down, a successful play gains four yards. On second down, a successful play gains half the remaining distance to converting the first down. On third down, a successful play converts first down. This theory informs the analysis at awesome websites like Football Outsiders and Advanced NFL Stats.

The chart above is a breakdown of the Lions first- and second-down plays against the Falcons. The first number in each box is the number of plays in that category. The number after the first slash is the number of “successful” plays, and the number after the second slash is the average yards-per-play rate of categorical plays. So.

The Lions faced 22 first-and-10 situations Sunday (including plays wiped out by penalties). They gained at least four yards 8/22 times, and averaged 6.59 yards per play. That sounds kinda okay-ish until you look at the run/pass breakdown: the Lions ran on first down 12 of 22 times, were successful twice, and averaged 3.83 YpC. This meshes with my “3-to-4 yards on first down is okay” theory until we go a little deeper.

Maurice Morris ran seven times on first down, never successfully, and averaged 2.0 yards per carry.

Keiland Williams fared a little better. He gained 4+ yards twice on five carries, including a long one that swelled the average up 6.4 YpC. However, neither could compare to the first-down passing game, which was successful six of ten attempts and averaged 9.9 YpA.

Megatron was targeted five times on first down, successfully three times, for a 16.2 average (yes, the 54-yard touchdown was on first down). Non-Megatron receivers were successful on 3 of 4 targets, for 5.75 YpA.

On second down, things were not much better. The running game chewed up half of the yards needed for conversion just twice on seven carries, though the YpC was an impressive 6.57. Part of that is due to a long run by MoMo, but part of it is the “on schedule” effect: the Lions average distance-to-conversion on second down was eight yards. This includes sacks, penalties, etc., but those count in the game, too. The Lions simply aren’t getting enough yards on first down, and it’s making second down much harder to convert.

The Lions running game was successful on first- and second-down just 4 of 19 carries, despite an apparently-excellent 4.84 YpC. The passing game was a better-but-still-not-great 11 of 23 plays for 6.91 YpA. Here’s the interesting bit, though: non-Megatron receivers were successful on 7 of 11 first- and second-down targets, for 6.09 YpA.

This points towards something else I’ve been saying: Stafford is pressing. He’s trying to force it to Calvin (see CJ’s second-down success rate above).  Despite the totally ineffective running game, when Stafford spreads the ball around the offense works. I’m wrong about Maurice Morris being a solid first- and second-down tailback, but I’m right that if Stafford does his job that doesn’t matter.

Read more...

In Defense of the Detroit Lions Offensive line

>> 10.06.2011

SPORTS NFL FOOTBALL

For decades the Lions offensive line has been a punching bag, both in physical and philosophical terms. This season is no different: fans have howled about the five-sack disaster in Minnesota, the abundance of penalties, and the continued inability to run impressively between the tackles. Nearly every Lions offensive lineman (excepting Rob Sims) has heard calls for his head on a pike, and it’s just barely October.

Line play was always one of the intricacies of the game; secret mojo that casual fans don’t perceive. Certain players or units are so consistently outstanding that analysts take pains to point them out, though, so most fans are dimly aware of “good” and “bad,” especially in terms of the quarterback’s time to throw.

Still, even hardcore fans can’t evaluate the offensive line in one full-speed viewing—at least, not without ignoring stuff like the ball and the outcome of the play. For the most part, fans judge their team’s offensive lines by the totality of their effort: number of sacks, number of penalties, average time to throw, perceived running lanes.

In recent years, though, the explosion of football information—and tools like DVR and NFL Game Rewind—lets us go back and see who really allowed Jared Allen’s sacks. Sort of.

If modern technology and analysis provide fans with a treasure trove of ways to evaluate their teams’ offensive line, what fans lack is any way to objectively compare that performance against others. When Cris Carter insisted Calvin Johnson is not an “elite” wide receiver, I slathered Carter’s good name in statistical napalm and lit a match.

When Lions fans say the offensive line “sucks,” I have few weapons with which to defend their honor—despite being sure the Lions’ line is a solid pass-blocking unit, and not a terrible run-blocking unit either. ESPN’s Ross Tucker explains:

It's not their fault. Or at least not entirely. That is the only logical explanation that can be drawn about the quality of offensive line play at the quarter pole of the NFL season.

Before you assume that this is a column written by a former offensive lineman attempting to absolve his trench brethren of their inadequacies, consider the facts. If close to 75 percent of the fans in the NFL think their teams' offensive line stinks, maybe the problem isn't actually the offensive line but rather what they are being asked to do?

At a minimum, fans and media alike need to look at the number of teams unhappy with offensive line play and realize that maybe this is the new normal. If that is the standard of performance for more than half of the teams in the league, then that is, by definition, the average.

Of course, the Internet’s gold standard in hardcore game footage review and line play evaluation is Pro Football Focus. I looked at the PFF team pass blocking grades over this year, last year, and the year before.

CHART?

Chart.

Pro Football Focus Team Pass Block Grade distribution, as charted by Ty at The Lions in Winter

This is the distribution of PFF team pass block grades for 2009, 2010, and 2011 to date. The X axis is standard deviation from the mean, and the Y axis is the number of teams who fall into the half-standard-deviation tiers. “-3.0” is three standard deviations below the mean, “0” is the mean, and “+3.0” is three standard deviations above the mean.

The first thing that jumps out at you is the way the 2009 line appears to disappear. In fact, 2009 and 2010 had the exact same distribution above the mean: eight teams between the mean and one-half standard deviation above, six teams between +0.5 and +1, five teams between +1 and +1.5, and no teams two standard deviations or more above the mean. In both seasons, then 19 teams were graded above the mean.

In both seasons there was a hearty group of “above average” pass blocking lines; the majority of NFL offensive lines were a little bit better than the mean. On the downside of those two slopes, the distributions are similar. They seesaw with a gap of two or three teams from –0.5 down to –2.5, where they each have one. Both years share an overall shape: a few awful teams, several bad teams, some “meh” teams, then most of the NFL is between “okay” to “good,” with just a few “pretty good” pass-blocking lines and no “very good” or “great” ones.

A quarter of the way through this year, a different shape is emerging. Only 16 teams are grading out above the median, meaning four fewer “good” or “pretty good” pass-blocking lines. The Tennessee Titans are that outlying bump at +2.5; an entire standard deviation above the second-best Buffalo Bills.

After that, though, it’s more bad news: nine teams are at least 1.5 standard deviations below the mean, compared to four in 2010 and six in 2009. That’s 28% of the league’s offensive lines at “bad” or worse!

Now here’s the interesting bit. We see that so far in 2010, there are fewer relatively “good” pass-blocking lines and more relatively “bad” ones. But that’s only relative to each other in the same season. What about year-over-year?

PFF normalizes all of their grades, meaning these grades aren’t just the raw scores. The first season they graded (2008), they adjusted the grades so they averaged out to zero. In subsequent seasons, they’ve normalized their grades with the same factors as from 2008—meaning, grades from 2009 and 2010 and 2011 will compare directly to 2008 (and each other).

Look at 2009’s mean: –0.22, or almost exactly zero. This means that PFF’s raw pass-blocking grades (and in theory, leaguewide pass-blocking performance) was almost identical from 2008 to 2009. But in 2010 that mean dropped to –18.56. In 2009, a team that graded out at –18.56 would have been binned in the “-0.5 to –1.0” tier! If we do an incredibly crude projection of this season’s grades (multiply by four), the average 2011 team will grade out at –24.99, very nearly a full standard deviation below 2009’s mean!

This implies that leaguewide pass blocking performance has declined dramatically from recent norms. Not only has the distribution changed so that more teams are “bad” at pass blocking while fewer are “good,” the standards for “bad” and “good” are noticeably lower. [Ed. – Upon further review, I added a second chart. Was in danger of violating 1 picture/thousand words rule.]

imageHere’s a better way of seeing the year-over-year change: the 2009 grades are an almost perfect expected distribution between extremes, norms, positives, and negatives. The 2010 grades have a nearly-identical shape, just with an across-the-board decrease. The 2011 grades, though crudely projected, again reflect a change in distribution: there are far more bad-to-awful lines, and far fewer decent-to-good ones.

PFF detractors will be quick to claim this as proof of flaws in their methodology; that’s certainly possible. But it dovetails perfectly with what Ross Tucker has observed: teams are passing at a ridiculous rate, and increasingly using tight ends and running backs as targets, rather than blockers. They’re hanging their offensive linemen out to dry to spread the defense and the ball around the field—and it’s showing in both passing effectiveness, and pass protection grades.

Throughout all three seasons, the Lions haven’t been more than a half a standard deviation off the mean. They were just below league average in 2009, just above it in 2010, and are just below it as we speak. This is the most pessimistic assessment of the Lions pass blocking I could find.

Football Outsiders ranks the Lions' pass protection as third-best in the NFL, with an Adjusted Sack Rate of 2.9%. The New York Life Protection Index currently ranks the Lions’ O-line 7th-best at keeping the quarterback clean. In both cases, they’d likely be topping the charts if it weren’t for the Minnesota game . . . which, given my suspicions about the Vikings’ eternally-rowdy home atmosphere, that really grinds my gears.

Jeff Backus is not Walter Jones. We know this. To our untrained eyes, the pass protection seems “lousy,” and the data suggests that our untrained eyes are absolutely right. But if our “lousy” is just about as good as everyone else’s “lousy,” then it’s not really all that lousy. And, if our “lousy” is really much better than everyone else’s “lousy,” as FO and the NYLPI imply, then we’d better learn to appreciate what we’ve got.

Read more...

Old Mother Hubbard: 2011 Post-Draft Heat Map

>> 6.01.2011

Without further ado, your 2011 Detroit Lions, as they exist post-draft, as graded by Pro Football Focus:

The 2011 Detroit Lions team needs heat map, powered by Pro Football Focus grades and The Lions In Winter's Old Motherr Hubbard analysis.

click for big

IMPORTANT INFORMATION:

  • All of the above colors represent that player's Pro Football Focus "overall" grade for 2011.
  • The grades have been banded into tiers, one half of one standard deviation from the mean for each position. Green is good, Red is bad, Gray indicates insufficient 2010 snaps, a rookie, or a hazy depth chart.
  • The main (inside) color is the presumed starter for 2011. The exterior ring is the presumed backup.
  • As a reminder, PFF's overall grade weighs penalties strongly; Corey Williams would be several tiers higher if not for his 13 penalties. PFF’s grade also tends to value consistency over sporadic big plays.
  • Brandon Pettigrew is the “starting” TE; Tony Scheffler the #2.
  • Nate Burleson is the #1 X receiver and #1 Y receiver; I anticipate he will be the X in 2-WR sets and Y in 3-WR sets.
  • Titus Young is the #2 X receiver and #2 Z receiver; I anticipate he will be the X in 3-WR sets.
  • Jahvid Best is the #1 RB; Mikel LeShoure the #2.
  • Quarterback data is not normalized, so I have not included it.
  • Corey Williams is the starting Nose Tackle (1-technique); Sammie Hill the #2.
  • Ndamukong Suh is the starting Over Tackle (3-technique); Nick Fairley the #2.
  • KVB and Lo-Jack are the #1 and #2 LDEs, respectively.
  • Cliff Avril and Willie Young are the #1 and #2 RDEs, respectively.
  • Bobby Carpenter and Ashlee Palmer are the starting RLB and LLB, respectively.
  • Chris Houston is CB1, Nate Vasher CB2, and Alphonso Smith NCB.
  • Amari Spievey is the LS, and Louis Delmas the RS.

Read more...

The Detroit Lions, the NFL, and Luck

>> 11.30.2010

Two weeks ago, Michael David Smith of the Wall Street Journal’s online edition wrote that the Detroit Lions may be the unluckiest team in NFL history.  Despite, at the time, outscoring their opponents, the Lions had won only 2 of 9 games.  Certainly, Lions fans expected better—and hoped for much better.  Infuriatingly, the Lions seem much improved, but there’s been no change in the bottom line.  However, it’s hard not to consider Bill Parcells’ famous line, “You are what your record says you are.”  Many fans, bloggers, and media pros subscribe to this idea: no matter how much more competitive the Lions look, they are not actually better until they have more Ws next to their name.

So, what do we make of this?  Do we ignore what our eyes tell us?  Do we disregard increased production on both sides of the ball as window treatments on the Titanic?  Or, do we foolishly embrace false “progress” because we’re so desperate to believe?  How much of the Lions’ 2-9 record can be blamed on happenstance, and how much of it is just the Lions’ lack of ability?  Fortunately, Brian Burke of Advanced NFL Stats recently wrote an article exploring exactly how random win-loss records are in the NFL.

Imagine flipping a perfectly fair coin 10 times. It would actually be uncommon for the coin to come out 5 heads and 5 tails. (In fact, it would only happen 24% of the time). But if you flipped the coin an infinite number of times, the rate of heads would be certain to approach 50%. The difference between what we actually observe over the short-run and what we would observe over an infinite number of trials is known as sample error. No matter how many times you actually flip the coin, it’s only a sample of the infinitely possible times the coin could be flipped.

As a prime example, the NFL's short 16-game regular season schedule produces a great deal of sample error. To figure out how much randomness is involved in any one season, we can calculate the variance in team winning percentage that we would expect from a random binomial process, like coin flips. Then we can calculate the variance from the team records we actually observe. The difference is the variance due to true team ability.

I strongly, strongly encourage you to read “The Randomness of Win-Loss Records” at Advanced NFL Stats in its entirety.  Go ahead, I’ll wait.

Okay, back?  Great.  Lost?  Don’t worry: I’ve got you covered with some bullet points:

  • 42% of an NFL team’s regular season record can be accounted for by randomness, otherwise known as sample error.
  • The correlation coefficient (r) between observed team records and a team’s true ability the square root of 0.58, which is 0.75.
  • After a full season of 16 games, your best guess of a team's true team strength should regress its actual record one quarter of the way back to the league-wide mean of .500.
  • The theoretical maximum accuracy of any predictive model is about .75. (from the comments, and Burke’s earlier work about luck & NFL outcomes).

If 42% of the Lions’ 2-9 record can be accounted for by randomness, that’s 4.62 games’ worth out of the eleven.  Assuming that the Lions have had nothing but bad luck to this point—they’re at the very nadir of randomness—then we flip it to nothing but good luck, we can see the theoretical maximum given this talent.  So, if Lions had gotten all the bounces: no Stafford injury, no Megatron Referee Fail, no Wendling/McCann freak TD return, no Alphonso Smith Disasters, Drew Stanton competes that pass, Shaun Hill doesn’t airmail that two-pointer (neither of which would happen anyway because Stafford would’ve been healthy, remember?), a few fewer specious penalties for the Lions, a few more for the opponents, recover a few more of the forced fumbles, catch a couple of dropped INTs . . . the Lions could be as good as 6-5 right now.

Before you freak out: that assumes both a 16-game season, and that the Lions are currently having the rottenest luck possible.  An 11-game sample isn’t the same as a 16-game sample; there may yet be some regression to the mean—that is, if the Lions really aren’t what their record says they are, their luck will turn before we get to the end of the season.  Well, either that, or next season will be a 16-game dip in the strawberry river:

Let’s assume for a second that there’s no sudden switch in the Lions’ fortunes, and they don’t sweep the NFC North at home during these next five games.  Let’s also assume they maintain their current pace: a winning percentage of .182.  Applied to 16 games, that’s 2.912 wins.  What’s the “best guess at their true strength,” if we regress them one-quarter of the way back to the mean?  If I understand this correctly, the difference between .500 and .182 is .318—and a quarter of that is .0795.  So, the Lions’ “true strength” should be a winning percentage of .262: just over four wins.

Again: this assumes the Lions only win one more game.  If the Lions finish 3-13, we’ll have no business saying “well this was really a 7-win team that got screwed.”  Sure, if everything had broken the Lions’ way, and they’d been the beneficiary of some truly rare luck, then maybe they’d have won six or seven games—but as they are, busted-up Stafford and all, if the Lions only win one more game, they really are only a 3-to-4 win team.

So, again, perspective: this is applying Brian Burke’s analysis of win/loss randomness in the NFL to the Detroit Lions’ current record.  All it can do is tell us, at the end of the season, what role “the Football Gods” have played in making the Lions’ record what it is—it is a redictive system, giving us a way of understanding what's already happened.  It can’t tell us which games were the result of randomness, if “the randomness” has already happened, or if the Lions are “due” for a hot streak.  It can’t tell us what we really want to know: how many games the Lions will win going forward. 

Let’s attack this from the other direction: with a predictive model, one that can actually assess teams' relative strengths and project a winner.  I’m choosing the Simple Ranking System, as published by Doug at Pro Football Reference.

Yes, this is required reading too.  Yes, I’ll wait.

Fortunately, it is as simple as the name implies, so it only requires one bullet:

  • Every team's rating is their average point margin, adjusted up or down depending on the strength of their opponents.

Okay, so average point differential, adjusted by strength of schedule, which adjusts the rankings, which adjusts the strengh of schedule, which adjusts the rankings, which adjusts the strength of schedule, over and over and over until the numbers stop changing.  Very simple indeed, yes—but as Doug says, “As it turns out, this is a pretty good predictive system.”

Chart?

Chart:

Team W L T W-L% PtDif SoS SRS
Green Bay Packers 7 4 0 0.636 103 1.2 10.6
New England Patriots 9 2 0 0.818 68 2.2 8.4
Pittsburgh Steelers 8 3 0 0.727 73 1.5 8.1
New York Jets 9 2 0 0.818 77 1 8
Atlanta Falcons 9 2 0 0.818 67 -0.1 6
Philadelphia Eagles 7 4 0 0.636 53 1.1 5.9
Baltimore Ravens 8 3 0 0.727 62 0.3 5.9
San Diego Chargers 6 5 0 0.545 85 -2.1 5.7
Tennessee Titans 5 6 0 0.455 39 0.5 4
Chicago Bears 8 3 0 0.727 50 -1.1 3.5
Indianapolis Colts 6 5 0 0.545 30 0.5 3.3
New York Giants 7 4 0 0.636 37 -1.4 1.9
Miami Dolphins 6 5 0 0.545 -20 3.5 1.7
Kansas City Chiefs 7 4 0 0.636 54 -3.3 1.6
New Orleans Saints 8 3 0 0.727 68 -4.5 1.6
Cleveland Browns 4 7 0 0.364 -13 1.4 0.2
Detroit Lions 2 9 0 0.182 -24 2.1 -0.1
Houston Texans 5 6 0 0.455 -23 1.5 -0.6
Oakland Raiders 5 6 0 0.455 -1 -1.9 -2
Minnesota Vikings 4 7 0 0.364 -50 2.5 -2.1
Buffalo Bills 2 9 0 0.182 -66 3.7 -2.3
Washington Redskins 5 6 0 0.455 -47 2 -2.3
Dallas Cowboys 3 8 0 0.273 -45 1.3 -2.8
Tampa Bay Buccaneers 7 4 0 0.636 -4 -3.1 -3.5
Cincinnati Bengals 2 9 0 0.182 -63 2 -3.7
Jacksonville Jaguars 6 5 0 0.545 -54 0.9 -4
St. Louis Rams 5 6 0 0.455 -18 -4.1 -5.8
Denver Broncos 3 8 0 0.273 -73 -0.1 -6.7
San Francisco 49ers 3 7 0 0.3 -59 -2.5 -8.4
Seattle Seahawks 5 6 0 0.455 -66 -3 -9
Arizona Cardinals 3 7 0 0.3 -104 -1.6 -12
Carolina Panthers 1 10 0 0.091 -136 -0.9 -13.3

Guess how this chart is sorted?  By SRS rank.  You can see the Packers, Patriots, Steelers, and Jets up there at the top, and Seahawks, Cardinals, and Panthers scraping the bottom of the barrel.  But wait, that team in bold, the one that’s darn near in the center?  That’s the Lions, ranked 18th overall.  When we take into account who they’ve played—per SRS, the Lions have played the 6th-hardest schedule in the NFL to this point—and how their offense and defense has performed, the Lions are the 18th-strongest team in the NFL.

This isn’t “with Stafford,” “with that Megatron touchdown,” “with that Drew Stanton pass,” or with anything imaginary added or subtracted.  Quite literally, it’s the scoreboard of every Lions game so far this year; it’s simply been adjusted by the scoreboards of everyone they’ve played.

Ah, but how accurate is this method?  It’s a predictive model, but how predictive is it?  Clearly, if it says the 2-9 Lions are near the middle of the pack in relative strength, it can’t be good at predicting who’ll win and who’ll lose, right?  Well, I regressed the SRS rankings against win percentage, and this is what I got:


image

Check out the correlation factor there: .7449205, or if you round up .001, .745.  What was the theoretical maximum for a predictive model again?  Well, if Brian Burke is right, it’s approximately .75.  That means that given the inherent randomness in NFL outcomes, the Simple Ranking System is as good as it gets when it comes to assessing relative strength of NFL teams, and thereby predicting future NFL outcomes.  Again, according to this system, the Lions are the 18th-best team in the land.  Further, if I’m not mistaken, they’re the biggest outlier on the chart: they’re the lowest, rightest dot (-0.1 SRS, .186 W-L).  Nobody’s getting screwed harder, or helped out more, by Lady Luck than the Lions.  Just trace the Y axis up to the line of best fit (the diagonal one), and you’ll know what the Lions’ win percentage ought to be: .500.  That’s right, SRS expects the Lions to have 5 wins by now.

So what does this all mean?  It means that if the Lions keep playing like they’ve been playing, they’re either going to pick up multiple wins in these last five games—or next season, they’ll be tubing down the strawberry river of regression to the mean.


Read more...

The Defensive Line and the Secondary, Part III

>> 7.23.2010

Throughout the offseason, it’s been speculated that the Lions’ woeful pass defense will get a boost from the revamped defensive line.  With Kyle Vanden Bosch and developing Cliff Avril on the ends, and Corey Williams and Ndamukong Suh joining Sammie Hill on the inside, the pass rush should be greatly improved.  This should, in turn, take pressure off the unproven secondary . . . right?

I set out to investigate this in part one, using the NFL’s league-wide data over the past two decades or so.  I tried to find correlation between seasons when sacks were up, and seasons when passing offense was down.  I think I learned more from the comments about how statistics and regression analysis work, than I did about the correlation between pass rush and pass defense—but my early results suggested that there is not a correlation between pass rush and pass defense.

I tried again with part two, blending pro-football-reference.com’s official and official-derived data for 2009, with profootballfocus.com’s manually film-reviewed defensive stats and grades.  I came up with a stat I called “pass rush rate,” which was opponent pass dropbacks (attempts + sacks) divided by cumulative sacks, hits, and pressures.  Then, I ran a simple correlation between every team’s pass rush rate for 2009, and their yards-per-attempt allowed.  The correlation was weak, –0.152. When squared to get the effect size, it was a negligible .023.

Importantly, the real-world analysis bore this out: the Jets had an extraordinary pass defense, by far the best in the NFL.  While their pass rush was solid, ranking 9th of 32 in pass rush rate, it was just that—solid, not phenomenal like the overall pass defense was.  Amazingly, the Cleveland Browns generated pressure on the quarterback more often than every team except Dallas and Minnesota—and yet, they were the fifth worst pass defense in the NFL!  Pass rush alone doesn’t make a defense effective.

For this installment, I wanted to get even more specific: I wanted to isolate defensive line pass rush from everything else.  After all, the idea is that getting an effective rush with just the front four will allow much greater flexibility in coverage and blitzing.  I aggregated the stats of just the defensive linemen, and compared them to what I already had.

Now, let me tell you a legendary tale . . . or, well, I guess, just a legend:

  • Name: The name of the team.
  • A: The primary defensive alignment.
  • Pass Rush Rate: The percentage of opponent dropbacks (Attempts + Sacks) on which the defense achieved a pressure stat (Sacks + QB Hits + Pressures + Batted Passes).
  • DL Pass Rush Rate: The percentage of opponent dropbacks (Attempts + Sacks) on which the defensive line achieved a pressure stat (Sacks + QB Hits + Pressures + Batted Passes).
  • % of rush from DL: The percentage of defensive pressure stats (Sacks + QB Hits + Pressures + Batted Passes) generated by defensive linemen.

NAME A Pass Rush Rate DL Pass Rush Rate % of rush from DL
Dallas Cowboys 3-4 48.2% 18.2% 37.8%
Minnesota Vikings 4-3 47.7% 38.9% 81.7%
Cleveland Browns 3-4 44.0% 19.1% 43.4%
Miami Dolphins 3-4 43.3% 36.0% 83.1%
Philadelphia Eagles 4-3 43.1% 35.4% 82.2%
New York Giants 4-3 43.0% 35.3% 82.0%
Atlanta Falcons 4-3 42.9% 35.1% 81.8%
Green Bay Packers 3-4 41.6% 13.5% 32.5%
Pittsburgh Steelers 3-4 41.3% 10.1% 24.4%
Houston Texans 4-3 41.2% 32.7% 79.4%
New York Jets HYB 40.3% 19.3% 47.9%
Denver Broncos 3-4 39.7% 13.1% 33.0%
Tennesee Titans 4-3 39.6% 36.0% 90.9%
San Francisco 49ers 3-4 39.4% 16.5% 41.9%
Washington Redskins 4-3 39.2% 29.2% 74.5%
Carolina Panthers 4-3 39.2% 35.4% 90.3%
Arizona Cardinals 3-4 38.5% 18.7% 48.6%
New England Patriots HYB 37.8% 18.8% 49.8%
Chicago Bears 4-3 37.3% 29.9% 80.1%
San Diego Chargers 3-4 37.3% 12.5% 33.5%
Kansas City Chiefs 3-4 37.1% 12.8% 34.5%
St. Louis Rams 4-3 37.0% 28.7% 77.5%
Oakland Raiders 4-3 36.6% 30.5% 83.3%
Tampa Bay Buccaneers 4-3 36.3% 29.6% 81.6%
Indianapolis Colts 4-3 35.8% 33.2% 92.8%
Baltimore Ravens 4-3 35.6% 25.2% 70.7%
Seattle Seahawks 4-3 34.2% 27.2% 79.4%
New Orleans Saints 4-3 34.2% 23.6% 69.2%
Buffalo Bills 4-3 32.5% 27.6% 84.9%
Cincinnati Bengals 4-3 32.2% 26.2% 81.3%
Detroit Lions 4-3 29.2% 23.5% 80.2%
Jacksonville Jaguars HYB 27.9% 10.3% 37.0%

We can see a few things in action here.  First, the Lions were terrible: second-worst in the NFL in Pass Rush Rate.  Second, the numbers get more wildly varied from left to right.  Most teams generate a pressure stat on 30-40% of the time their opponents drop back to pass, with the extremes at 27.9% and 48.2%.  Most teams generate pressure from the defensive line between 15-35% of the time, with extremes at 10.1% and 38.9%.  The percentage of the pass rush that comes from the defensive line is all over the board, from 92.8% all the way down to 24.4%.  What does this mean?

Given the amazingly wide range of percentage-of-pass-rush-from-defensive-line stats, and the zero (okay –.120, R-squared .014) correlation between them and Pass Rush Rate, I knew that scheme was a major factor.  The Colts generated almost all of the pass rush from the defensive line, just as a Tampa 2 is supposed to.  Their two ends, Robert Mathis and Dwight Freeney, accounted for 24 of Indy’s 33 sacks, 23 of 45 hits, 78 of 139 pressures, and 1 of 4 batted balls.  That’s right, Mathis and Freeney were fifty-seven percent of the Colts’ pressure statistics; they were the Colts’ pass rush.  Meanwhile the Steelers, despite having one of the league’s better pass rushes, got only 24.4% of their rush from their line.

  I separated the teams out by scheme, grouping 4-3 teams together, and 3-4 and hybrid teams together.  Since the Lions are a 4-3 team, and that’s what this exercise is all about, I discarded the 3-4s and the hybrids, and set about correlating PRR with Y/A, for just 4-3 teams:

2009 NFL 4-3 Defense Pass Rush Rate vs. Yards per Attempt

Okay, so these are the 2009 4-3 defenses, and their overall Pass Rush Rate regressed against opponent Yards per Attempt.  Look at the R-squared; there is literally zero correlation between these two statistics.  Okay, we expected that to an extent—but what if we do it for just defensive line?  If the rush is getting there without blitzing, that should make coverage better—so, we should see a tighter correlation when we regress DL-only Pass Rush Rate against Y/A Allowed:

2009 NFL 4-3 Defensive Lines Pass Rush vs. Yards per Attempt

That’s a little itsy bit better, but there’s still no real correlation happening here.  Okay, what if we do it for percentage of pass rush that comes from the defensive line?

2009 NFL 4-3 Defensive Line Pressure vs. Yards per Attempt

Okay, we’re making tiny, tiny incremental progress, but this is still nothing we can call correlation.  Yards per Attempt, my favorite measure of per-play passing effectiveness, is completely disconnected from pass rush, DL-only pass rush, and percentage of pass rush generated by the DL.  But we know for a fact that teams with good pass rushes have good defenses, right?  I mean, the Vikings have a good defense, right?  Right.
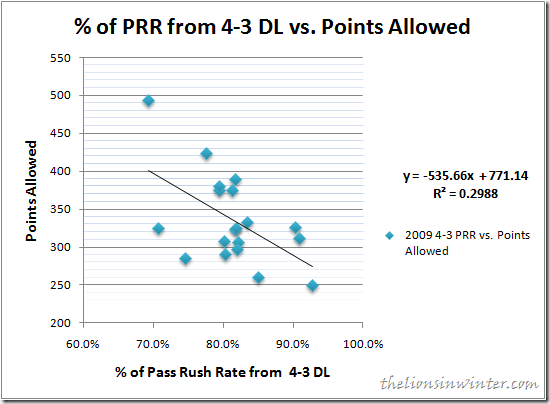
2009 NFL 4-3 Defensive Line Pressure vs. Points Allowed

Okay, now we’re talking.  In all of my pass rush data mining, the strongest meaningful correlation I could find was between what percentage of pass rush comes from a 4-3 defensive line, and how many points that defense surrendered on the year.  As I said way back in part one:

We're left with the depressing conclusion that the only good pass defense is good pass defense. However, that's not really the case, either. Sacks and interceptions, though they don’t affect the interplay of pass offense and pass defense outside of themselves, are still extremely important in terms of total defense. Stopping drives and preventing scoring is the primary job of a defense; a third-down sack or a red-zone INT can erase sixty or seventy yards’ worth of Montanaesque passing effectiveness.

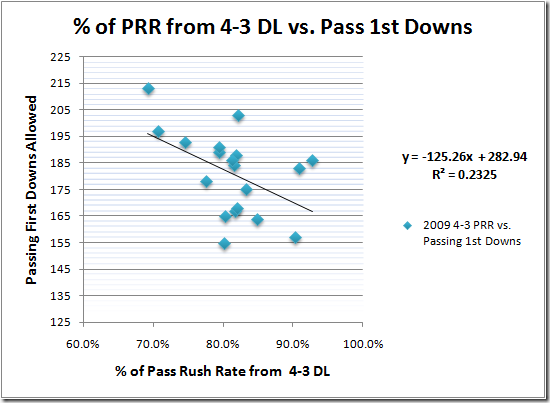
So again, as I’ve been saying: an improved pass rush won’t improve a team’s pass defense—but it will improve the team’s scoring defense.  Here’s the second-strongest correlation I found: percentage of PRR from a 4-3 DL regressed against Passing 1st Downs Allowed:
image

Okay, again, this makes sense: the more pass rush you can generate from your 4-3 defensive line, the fewer passing first downs you allow . . . but we’re not done yet.  I calculated the simple correlation factors for every offensive stat I thought might be illuminating.  Note that these are NOT the R-squared effect sizes you see in the charts above—since that eliminates the direction of the correlation, which is important here.  To get those effect-size figures, square the amounts in this table:

Category %DB/P %DB/DLP %P/DL Att/PD
points -0.133 -0.360 -0.547 -0.237
total first downs -0.007 -0.210 -0.431 -0.262
passing first downs -0.015 -0.241 -0.482 -0.132
running first downs -0.187 -0.257 -0.232 -0.114
yards per attempt -0.064 -0.139 -0.190 -0.062
yards per completion -0.147 -0.316 -0.418 -0.293
completion percentage 0.135 0.269 0.325 0.356
interceptions -0.133 -0.081 0.037 0.165
touchdowns 0.175 0.205 0.123 0.134
passer rating 0.156 0.148 0.049 0.012

Look at completion percentage: there is a weak, but positive correlation between PRR, defensive line PRR, and percentage of PRR from DL and completion percentage.  So, as the defensive line gets more pressure, generally quarterbacks complete more of their passes—but, at what cost?  Look again at yards per completion; there’s a moderate negative correlation between increased DL pressure and average completion length.

There is a definable “cringe effect!”  When the defensive line generates more pressure, offenses generally tend to complete more and shorter passes—“going into a shell,” as it’s called.  It’s this mechanism, completing more passes for fewer yards, that explains why yards-per-attempt allowed doesn’t change as the pass rush rate increases.  Teams will dink-and-dunk in the face of the rush—meaning they convert fewer third downs, and score fewer points.

So.  How much better will the Lions’ defensive line have to be?  Well, as we saw, their pass rush numbers are terrible.  In order for the Lions to improve their Pass Rush Rate to the league average, they’d have to increase it from 29.2% of snaps to 37.7%.  To increase DL PRR to league average, they’d have to increase it from 23.5% to 30.7%.  The percentage of PRR from the DL is about right, 80.2% versus 81.3%.

The league average team faced 567 dropbacks last year, compared to the Lions’ 571, so I’ll normalize the Lions’ pressure stats to 99.3%: 22.83 QB sacks, 34.76 QB hits, 100.29 QB pressures, and 7.94 batted passes.  I’ll do the same for the DL pressure stats, from 18 to 17.86, from 26 to 25.82, from 82 to 81.43, and from 8 to 8.94.  Now, to compare to the NFL average, find the difference, and voila:

Team/Data %DB/P %DB/DLP %P/DL QBSk QBHt QBPr BP DLSk DLHt DLPr DLBP
Detroit Lions (normalized) 29.2% 23.5% 80.2% 22.83 34.76 100.29 7.94 17.86 25.82 81.43 7.94
NFL Average 4-3 37.7% 30.7% 81.3% 33.00 52.00 118.00 10.00 25.00 40.00 98.00 9.00
Delta (absolute) 8.5% 7.2% 1.1% 10.17 17.24 17.71 2.06 7.14 14.18 16.57 1.06
Delta (percentage) 29.1% 30.6% 1.4% 44.5% 49.6% 17.7% 25.9% 40.0% 54.9% 20.4% 13.3%

We can conclude that, in order to bring their pass rush up to NFL average levels for a 4-3, their defensive line will have to increase their sack rate by 40%, their hit rate by 54.9%, their pressure rate by 20.4%, and their batted-ball rate up by 13.3%—and they’ll need a few more sacks and hits from the linebackers and secondary, as well.  I’m still working on projecting all that data out into points allowed, first downs allowed, etc., but there you have it.  If the Lions face the same number of dropbacks in 2010 that the average NFL team did in 2009, the difference between KVB/Avril/Williams/Suh and Avril/Hunter/Cohen/Hill will have to be worth an improvement of 7 sacks, 14 hits, 17 pressures, and 1 batted ball over 2009’s 18, 26, 82, and 8 to get back to average.


Read more...

The Defensive Line and The Secondary

>> 5.26.2010

Lions fans worrying about the secondary have been closing their eyes, clicking their heels, and chanting, “The defensive line, the defensive line, the defensive line.”  They’re telling themselves the additions of Kyle Vanden Bosch, Corey Williams, and Ndamukong Suh will drastically improve the pass rush, thereby shortening the field for the secondary.  They’re telling themselves that opposing quarterbacks won’t have time to attack Chris Houston, Jonathan Wade, and Amari Spievey. 

Are they telling themselves the truth?  Can an improved pass rush really hide substandard secondary play?  How much better would the defensive line need to be to cover up the lackluster coverage?

First, I went to my favorite NFL stats database, Pro-Football-Reference.com.  I decided to go back to 1982, the year the league started keeping track of sacks as an official stat.  I started with my favorite metric of passing efficiency, net per-play yards per attempt.  The idea, if I understand correctly, is to measure the mean yards gained on every dropback.

So, my first task was simple: plot the correlation between sacks, and net-per-play yards attempt.  This should show us if there is indeed a correlation between pass rush effectiveness (expressed in sacks), and depressed passing efficiency.  There is a critical assumption, though:

  • We assume that if sacks per dropback are significantly up or down across the NFL, there has been an increase or decrease in total pass rush effectiveness that season.
image

Wow, that looks pretty good right there!  It sure looks like there’s a nice little cluster around the trend line, and . . . wait.  What’s that one lonely data point all down there by itself?  Ah, it’s 1982, the strike year.  That explains it: since they only played nine games, most stats were just about halved, including sacks.

. . . wait.  I used the wrong values.  The total, leaguewide number of sacks will vary with number of attempts.  In years where teams ran fewer plays, or passed less often, the number of total sacks would be lower—but that wouldn’t mean there was a decrease in pass rush effectiveness.  No, what we want is sack rate; how often running a pass play results in a sack.  I switched the X axis to average number of attempts per sack, and tried again.  Remember, the hypothesis is that in years where sacks occurred more often, NY/A should be depressed.

image

The coefficient of correlation here is .451.  For those of you who, like me, remember nothing of the high school math you didn’t understand at the time anyway: zero is no correlation at all, and 1 is perfect correlation.  I’m not a statistician; I don’t know how to determine if this correlation is “statistically significant,” quote-unquote, but it seems fairly strong, and is definitely nonzero.

However, we have a problem: “Net Yards per Attempt” includes sacks.  It’s attempts plus sacks, over passing yards minus sack yards.  The higher the sack rate, the more passing yardage will be depressed—so our correlation is artificially enhanced.

Removing sack yardage from the equation, here’s the same chart:

image

Now our chart looks nearly random.  The correlation coefficient is .068; approaching zero.  Our hypothesis, that there is a correlation between increased pass rush and depressed passing effectiveness, is in rough shape.

There’s some data I’d really like to have that I don’t, namely “QB hurries” or “QB pressures”. These are plays where the pass rush was disruptive, but didn’t result in a sack.  Unfortunately, that data isn’t official, and is likely to be quite subjective even if we had it.  So, going forward:

  • We have found that there is no inverse correlation between that pass rush effectiveness and passing effectiveness; on plays where a sack does not occur, per-play pass yardage is unaffected.

However, we know that there is such a thing as "good pass defense."  If a pass rush that’s getting more sacks isn’t it, then what is?  The first answer that springs to mind is “a defense that gets lots of interceptions,” right?  So, here’s interception rate per attempt, against raw yards per attempt:

image

Ugh, another scattershot plot.  The correlation is –.091, again nonzero but not strong.  Again we see: interceptions are certainly a good thing to get, but a defense that gets a lot of interceptions isn’t necessarily a “good pass defense”.  Just as with sacks, when you’re not actually picking a pass off, a high interception rate doesn’t help you much.

  • We have found that there is no inverse correlation between interception rate and passing effectiveness; on plays where an interception does not occur, per-play pass yardage is unaffected.

So again, if there’s such a thing as “good pass defense,” is there a stat that directly correlates to it?  Yes, I think there is: passes defensed.

Unfortunately, it's only been tracked since 2001—and in 2002, the total number of passes defensed, league wide, was about half of what it’s been in every other year.  I don’t know  what happened there, but you can see it on the chart:

image

Yeah, that’s an outlier.  Given that it was only the second year of tracking the statistic, it’s not unexpected.  We drop it, and:

image

Ah-HA!  The correlation coefficient is .495, and we see a clear trend emerging.  We only have eight data points, but there’s correlation that isn’t built-in: on plays where the quarterback threw the ball forward, the more frequently passes were broken up, the less effective pass offense was, and vice versa.

One might point out that a pass defensed is an incomplete pass, so greater numbers of them necessarily lower YPA—but  the same is true of interceptions, and we saw no such correlation above.  The sample size is also troubling, in terms of establishing a statistical trend—but remember, each data point represents every passing attempt in the NFL for an entire season.

  • We have found that there is a correlation between passes defensed and passing effectiveness; on plays where a pass is not defensed, per-play pass yardage is still depressed.
  • We can assume that if passes defensed per pass attempt are significantly up or down across the NFL, there has been an increase or decrease in total pass coverage effectiveness that season.

We're left with the depressing conclusion that the only good pass defense is good pass defense.  However, that's not really the case, either.  Sacks and interceptions, though they don’t affect the interplay of pass offense and pass defense outside of themselves, are still extremely important in terms of total defense.  Stopping drives and preventing scoring is the primary job of a defense; a third-down sack or a red-zone INT can erase sixty or seventy yards’ worth of Montanaesque passing effectiveness.

image

What's happening here?  Follow the blue line, passing YPA.  See the big dip it took in 2003?  And the subsequential huge spike in 2004?  That was a result of the Ty Law Rule, a change in the enforcement of Pass Interference and Illegal Contact rules.  It’s named for the extremely effective, physical press coverage that Ty Law and the Patriots popularized in 2001, 2002, and 2003.  The refs were “letting them play,” and the result was that passing was depressed.

In 2004, though, the refs started throwing the hankies, and passing effectiveness exploded as the press corners backed off.  As teams could no longer afford to let their corners maul wideouts one-on-one, more safeties had to be rolled over to help.  As more safeties rolled over to help, tight ends, backs, and slot receivers flourished.  As more tight ends, backs, and slot receivers have flourished, more and more teams have switched from 4-3 fronts and man-to-man coverage, to 3-4/4-3 hybrids and zone coverage.

The upshot is that passing is getting more and more effective. Schemes are more complex, quarterbacks are sharper, and multi-back, multi-WR sets—difficult to defend with a traditional press defense—are forcing defenses to attempt aggressive, flexible disruption, with a broad safety net, rather than lining up 11-on-11 and winning battles.

What does this mean for the Lions?  Likely the obvious: we’ll see lots more pressure, including lots more sacks, and that will improve the scoring defense—though not by nearly as much as is needed for the Lions to be a consistent winner.  Ndamukong Suh and Kyle Vanden Bosch will not make the secondary any less porous, and teams—when they get a pass off—will still torch the Lions for long gains with great regularity.

Real statisticians, please, please, enlighten me in the comments.

UPDATE: I’ve followed this article up with Part II and Part III, drilling down much farther and finding really interesting stuff; check them out.

Read more...

  © Blogger template Simple n' Sweet by Ourblogtemplates.com 2009

Find us on Google+

Back to TOP