Showing posts with label pro football reference. Show all posts

Detroit Lions 2011 Regular Season: Halfway There

>> 11.03.2011

Everyone is furiously trying to prove that this 6-2 start capped by a blowout of the Broncos is not the same as 2007’s 6-2 start capped by a blowout of the Broncos. I have something different in mind.

In the Old Mother Hubbard series, I attempt to contextualize individual Lions performances. We watch these guys all season long year after year after year, and we lose perspective on their strengths and weaknesses. I use Pro Football Focus data and radar charts to give you an at-a-glance impression of how Lions are performing against the high, low, and average NFL performances at the same position.

So, if we’re taking the temperature of the Lions at the bye/halfway point . . . why not do the same thing?
image

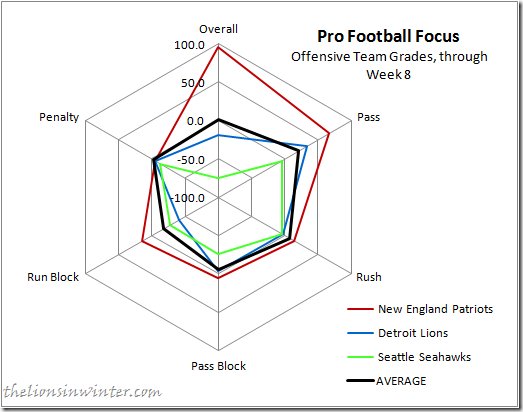
Here are the offensive team grades through Week 8. The dark red line is the New England Patriots, #1-graded offense in the NFL. The bright green line is the Seattle Seahawks, #32-graded offense in the NFL. The thick black line is, as always, the NFL average, and the Honolulu Blue line is the Lions.

This is going to surprise some folks, because we perceive the Lions offense to be one of the best in the NFL—and indeed it is the 4th-best, scoring 29.9 points per game. Keep in mind PFF’s “consistency bias,” as I call it: PFF’s system prefers consistently above-average play to streaky home-run hitters. It’s true for individual players like Ndamukong Suh and Jahvid Best, and it’s true for the Lions as a whole.

No surprise, the Lions’ pass offense was graded 8th-best, at +33.2. Also unsurprisingly, the Lions’ rushing game was well below average; the third-worst in fact. But look: the difference between the best running grades and the worst running grades is miniscule.  Having a very poor running game doesn’t grade out much worse than having an average running game. This is a recurring theme this season.

As far as the offensive line goes, it's no surprise to anyone who’s listened to me or PFF over the years: the Lions do an above-average job of pass blocking. They graded –3.7 (average –6.18) over the course of the season. Also no surprise: they can’t run block for crap. The Lions have the fourth-worst run-blocking line in the NFL to this point, at -40.8 (average –18.15).

On offense, the Lions have taken more penalties than most; they’re ranked 24th with a –5.5 penalty grade. However, since the NFL average is –3.11, that’s not crippling. On the whole, the grades show the Lions have a very good passing offense, a decent pass-blocking offensive line, a terrible running game and a terrible run-blocking offensive line. Add it all up and it’s surprisingly mediocre for a team scoring 30 points per game. Once again, we see: the running game doesn’t matter.
image

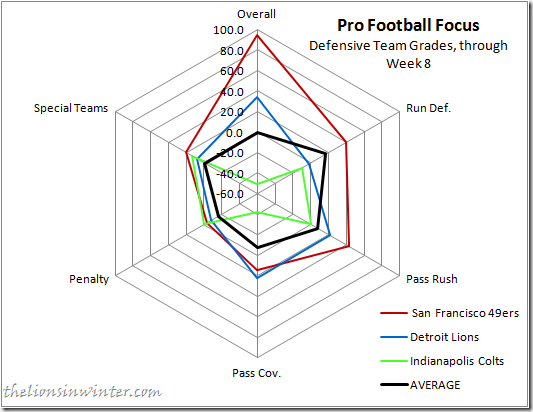
The 49ers have a ridiculous defense. I mean, geez. Just look at that. Also: Indy NOOOOOO!

But check out the Lions: 8th-best graded defense overall, graded +33.7. This jibes with their 6th-lowest scoring defense (18.4 PpG). The run defense is ranked 24th, just –2.2 overall—and the average is +14.8, meaning that’s truly not good. The pass rush, again, is what you’d think: 5th-best in the NFL, graded +21.7 (avg. +8.06).

The jawdropper, though: The Detroit Lions have the best pass coverage grade in the NFL. Not pass defense, not pass rush, not statistical derivation: the play of their corners and safeties grades out better than any other team in the NFL. At +22.1, they’re well ahead of the 49ers’ second-place unit (+14.4), and have lapped the rest of the field (avg. –7.74).

The Lions defense is, as it was last season, heavily penalized. Their -7.9 grade is ranked 27th, well below the –3.4 league average—but not as horrific as it’s been. Special teams-wise, the Lions grade out at +7.4—but that’s not all that, because the average is +12.65.

On the whole, we’re left with a promising, but mixed bag. The Lions offense is struggling to move the ball consistently, but is generating points through the air with home run plays. The run blocking is awful, as is the running game as a whole. The defense is a top ten unit, despite poor run-stopping and penalty grades, because they rush the passer better than most—and cover the pass better than anyone.

At the moment, the Lions are in fantastic shape for the playoffs. My favorite predictive football model, the Simple Rating System, LOVES what the Lions have done this year. It’s a combination of strength of schedule and points differential, and at the halfway point the Lions are the second-highest-rated team in the NFL. Given the teams they’ve played and the results of those games, SRS expects the Lions to be the second-hardest out in football (after the Packers) going forward.

Of course, the Lions play the Packers twice throughout the rest of the season, so SRS would project a final finish of 12-4. Could that really happen? Bizarrely, yes. The road games against Chicago and New Orleans are possible (if not likely) losses—but the Lions should be able to split with the Pack, considering they did so last season without Matthew Stafford. The games at Oakland and against San Diego are worlds less scary than they were a few weeks ago, too.

Let’s be clear: I’m not projecting, or claiming, or promising a 12-4 season. I AM promising, projecting, and claiming that the Lions are going to make the playoffs, as I have since May, and have never wavered from. The Lions are only halfway there, but right now that Lions Kool-Aid tastes sweeter than ever.

Read more...

The Detroit Lions, the NFL, and Luck

>> 11.30.2010

Two weeks ago, Michael David Smith of the Wall Street Journal’s online edition wrote that the Detroit Lions may be the unluckiest team in NFL history.  Despite, at the time, outscoring their opponents, the Lions had won only 2 of 9 games.  Certainly, Lions fans expected better—and hoped for much better.  Infuriatingly, the Lions seem much improved, but there’s been no change in the bottom line.  However, it’s hard not to consider Bill Parcells’ famous line, “You are what your record says you are.”  Many fans, bloggers, and media pros subscribe to this idea: no matter how much more competitive the Lions look, they are not actually better until they have more Ws next to their name.

So, what do we make of this?  Do we ignore what our eyes tell us?  Do we disregard increased production on both sides of the ball as window treatments on the Titanic?  Or, do we foolishly embrace false “progress” because we’re so desperate to believe?  How much of the Lions’ 2-9 record can be blamed on happenstance, and how much of it is just the Lions’ lack of ability?  Fortunately, Brian Burke of Advanced NFL Stats recently wrote an article exploring exactly how random win-loss records are in the NFL.

Imagine flipping a perfectly fair coin 10 times. It would actually be uncommon for the coin to come out 5 heads and 5 tails. (In fact, it would only happen 24% of the time). But if you flipped the coin an infinite number of times, the rate of heads would be certain to approach 50%. The difference between what we actually observe over the short-run and what we would observe over an infinite number of trials is known as sample error. No matter how many times you actually flip the coin, it’s only a sample of the infinitely possible times the coin could be flipped.

As a prime example, the NFL's short 16-game regular season schedule produces a great deal of sample error. To figure out how much randomness is involved in any one season, we can calculate the variance in team winning percentage that we would expect from a random binomial process, like coin flips. Then we can calculate the variance from the team records we actually observe. The difference is the variance due to true team ability.

I strongly, strongly encourage you to read “The Randomness of Win-Loss Records” at Advanced NFL Stats in its entirety.  Go ahead, I’ll wait.

Okay, back?  Great.  Lost?  Don’t worry: I’ve got you covered with some bullet points:

  • 42% of an NFL team’s regular season record can be accounted for by randomness, otherwise known as sample error.
  • The correlation coefficient (r) between observed team records and a team’s true ability the square root of 0.58, which is 0.75.
  • After a full season of 16 games, your best guess of a team's true team strength should regress its actual record one quarter of the way back to the league-wide mean of .500.
  • The theoretical maximum accuracy of any predictive model is about .75. (from the comments, and Burke’s earlier work about luck & NFL outcomes).

If 42% of the Lions’ 2-9 record can be accounted for by randomness, that’s 4.62 games’ worth out of the eleven.  Assuming that the Lions have had nothing but bad luck to this point—they’re at the very nadir of randomness—then we flip it to nothing but good luck, we can see the theoretical maximum given this talent.  So, if Lions had gotten all the bounces: no Stafford injury, no Megatron Referee Fail, no Wendling/McCann freak TD return, no Alphonso Smith Disasters, Drew Stanton competes that pass, Shaun Hill doesn’t airmail that two-pointer (neither of which would happen anyway because Stafford would’ve been healthy, remember?), a few fewer specious penalties for the Lions, a few more for the opponents, recover a few more of the forced fumbles, catch a couple of dropped INTs . . . the Lions could be as good as 6-5 right now.

Before you freak out: that assumes both a 16-game season, and that the Lions are currently having the rottenest luck possible.  An 11-game sample isn’t the same as a 16-game sample; there may yet be some regression to the mean—that is, if the Lions really aren’t what their record says they are, their luck will turn before we get to the end of the season.  Well, either that, or next season will be a 16-game dip in the strawberry river:

Let’s assume for a second that there’s no sudden switch in the Lions’ fortunes, and they don’t sweep the NFC North at home during these next five games.  Let’s also assume they maintain their current pace: a winning percentage of .182.  Applied to 16 games, that’s 2.912 wins.  What’s the “best guess at their true strength,” if we regress them one-quarter of the way back to the mean?  If I understand this correctly, the difference between .500 and .182 is .318—and a quarter of that is .0795.  So, the Lions’ “true strength” should be a winning percentage of .262: just over four wins.

Again: this assumes the Lions only win one more game.  If the Lions finish 3-13, we’ll have no business saying “well this was really a 7-win team that got screwed.”  Sure, if everything had broken the Lions’ way, and they’d been the beneficiary of some truly rare luck, then maybe they’d have won six or seven games—but as they are, busted-up Stafford and all, if the Lions only win one more game, they really are only a 3-to-4 win team.

So, again, perspective: this is applying Brian Burke’s analysis of win/loss randomness in the NFL to the Detroit Lions’ current record.  All it can do is tell us, at the end of the season, what role “the Football Gods” have played in making the Lions’ record what it is—it is a redictive system, giving us a way of understanding what's already happened.  It can’t tell us which games were the result of randomness, if “the randomness” has already happened, or if the Lions are “due” for a hot streak.  It can’t tell us what we really want to know: how many games the Lions will win going forward. 

Let’s attack this from the other direction: with a predictive model, one that can actually assess teams' relative strengths and project a winner.  I’m choosing the Simple Ranking System, as published by Doug at Pro Football Reference.

Yes, this is required reading too.  Yes, I’ll wait.

Fortunately, it is as simple as the name implies, so it only requires one bullet:

  • Every team's rating is their average point margin, adjusted up or down depending on the strength of their opponents.

Okay, so average point differential, adjusted by strength of schedule, which adjusts the rankings, which adjusts the strengh of schedule, which adjusts the rankings, which adjusts the strength of schedule, over and over and over until the numbers stop changing.  Very simple indeed, yes—but as Doug says, “As it turns out, this is a pretty good predictive system.”

Chart?

Chart:

Team W L T W-L% PtDif SoS SRS
Green Bay Packers 7 4 0 0.636 103 1.2 10.6
New England Patriots 9 2 0 0.818 68 2.2 8.4
Pittsburgh Steelers 8 3 0 0.727 73 1.5 8.1
New York Jets 9 2 0 0.818 77 1 8
Atlanta Falcons 9 2 0 0.818 67 -0.1 6
Philadelphia Eagles 7 4 0 0.636 53 1.1 5.9
Baltimore Ravens 8 3 0 0.727 62 0.3 5.9
San Diego Chargers 6 5 0 0.545 85 -2.1 5.7
Tennessee Titans 5 6 0 0.455 39 0.5 4
Chicago Bears 8 3 0 0.727 50 -1.1 3.5
Indianapolis Colts 6 5 0 0.545 30 0.5 3.3
New York Giants 7 4 0 0.636 37 -1.4 1.9
Miami Dolphins 6 5 0 0.545 -20 3.5 1.7
Kansas City Chiefs 7 4 0 0.636 54 -3.3 1.6
New Orleans Saints 8 3 0 0.727 68 -4.5 1.6
Cleveland Browns 4 7 0 0.364 -13 1.4 0.2
Detroit Lions 2 9 0 0.182 -24 2.1 -0.1
Houston Texans 5 6 0 0.455 -23 1.5 -0.6
Oakland Raiders 5 6 0 0.455 -1 -1.9 -2
Minnesota Vikings 4 7 0 0.364 -50 2.5 -2.1
Buffalo Bills 2 9 0 0.182 -66 3.7 -2.3
Washington Redskins 5 6 0 0.455 -47 2 -2.3
Dallas Cowboys 3 8 0 0.273 -45 1.3 -2.8
Tampa Bay Buccaneers 7 4 0 0.636 -4 -3.1 -3.5
Cincinnati Bengals 2 9 0 0.182 -63 2 -3.7
Jacksonville Jaguars 6 5 0 0.545 -54 0.9 -4
St. Louis Rams 5 6 0 0.455 -18 -4.1 -5.8
Denver Broncos 3 8 0 0.273 -73 -0.1 -6.7
San Francisco 49ers 3 7 0 0.3 -59 -2.5 -8.4
Seattle Seahawks 5 6 0 0.455 -66 -3 -9
Arizona Cardinals 3 7 0 0.3 -104 -1.6 -12
Carolina Panthers 1 10 0 0.091 -136 -0.9 -13.3

Guess how this chart is sorted?  By SRS rank.  You can see the Packers, Patriots, Steelers, and Jets up there at the top, and Seahawks, Cardinals, and Panthers scraping the bottom of the barrel.  But wait, that team in bold, the one that’s darn near in the center?  That’s the Lions, ranked 18th overall.  When we take into account who they’ve played—per SRS, the Lions have played the 6th-hardest schedule in the NFL to this point—and how their offense and defense has performed, the Lions are the 18th-strongest team in the NFL.

This isn’t “with Stafford,” “with that Megatron touchdown,” “with that Drew Stanton pass,” or with anything imaginary added or subtracted.  Quite literally, it’s the scoreboard of every Lions game so far this year; it’s simply been adjusted by the scoreboards of everyone they’ve played.

Ah, but how accurate is this method?  It’s a predictive model, but how predictive is it?  Clearly, if it says the 2-9 Lions are near the middle of the pack in relative strength, it can’t be good at predicting who’ll win and who’ll lose, right?  Well, I regressed the SRS rankings against win percentage, and this is what I got:


image

Check out the correlation factor there: .7449205, or if you round up .001, .745.  What was the theoretical maximum for a predictive model again?  Well, if Brian Burke is right, it’s approximately .75.  That means that given the inherent randomness in NFL outcomes, the Simple Ranking System is as good as it gets when it comes to assessing relative strength of NFL teams, and thereby predicting future NFL outcomes.  Again, according to this system, the Lions are the 18th-best team in the land.  Further, if I’m not mistaken, they’re the biggest outlier on the chart: they’re the lowest, rightest dot (-0.1 SRS, .186 W-L).  Nobody’s getting screwed harder, or helped out more, by Lady Luck than the Lions.  Just trace the Y axis up to the line of best fit (the diagonal one), and you’ll know what the Lions’ win percentage ought to be: .500.  That’s right, SRS expects the Lions to have 5 wins by now.

So what does this all mean?  It means that if the Lions keep playing like they’ve been playing, they’re either going to pick up multiple wins in these last five games—or next season, they’ll be tubing down the strawberry river of regression to the mean.


Read more...

  © Blogger template Simple n' Sweet by Ourblogtemplates.com 2009

Find us on Google+

Back to TOP